
Market Outlook 2024
After more than a decade of stocks traveling a path paved by historically and persistently low interest rates, higher yields have driven a winding road for market returns in recent years. In 2024, we think markets will navigate the last mile in the inflation and Federal Reserve tightening cycles, bringing more open road but also some bumps along the way.
Equities and bonds fell into a bear market in 2022 as the Fed began hiking interest rates to fight four-decade-high inflation. 2023 brought periods of sharply rising and falling interest rates, with stocks staging a solid rebound.
We think 2024 will bring the next phase of the cycle. Inflation should continue to moderate amid a slowing economy. And we expect the Fed to slowly transition away from a restrictive interest rate policy, helping clear the road for a renewed expansion.
The market won’t dodge every pothole as this takes shape. But we think 2024 will ultimately prove to be a positive year for both stock and bond returns.
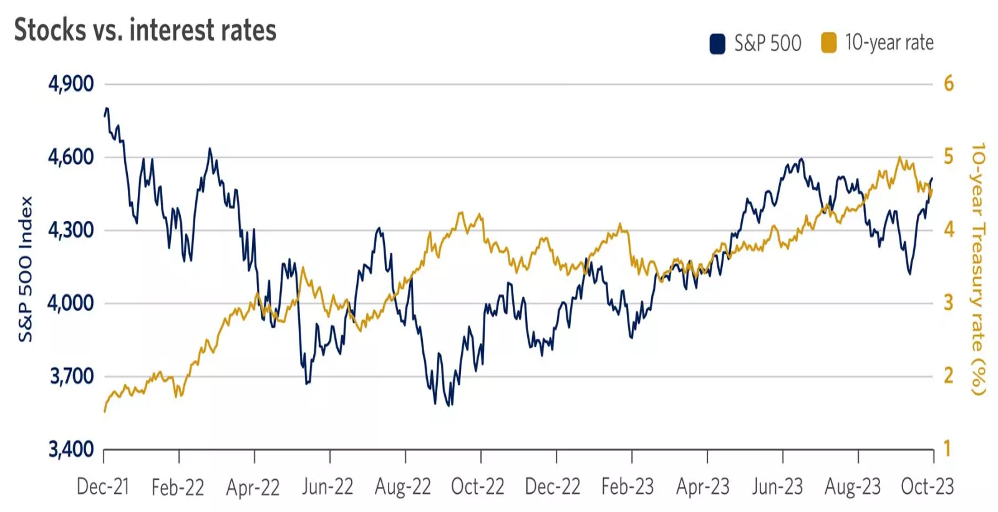
Source: FactSet, S&P 500 Index, 10-year Treasury yield.
Chart description: This graph shows a winding path for both stocks and the 10-year Treasury yield since December 2021.
Here are 10 of our key views of the market for 2024.
1. The economy moderates before rebounding in the second half of 2024
The U.S. economy remained remarkably resilient for much of 2023, with GDP growth above 2% annualized for the first three quarters of the year. This was driven in large part by healthy consumption growth: Households continued to spend despite rapidly rising interest rates and tightening lending conditions.
We expect U.S. economic growth to soften in the first half of 2024, with growth rates likely falling to below 1.5% annualized. We believe somewhat weaker consumption, lower government spending and a cooling labor market will translate to slower growth.
The consumer faces some challenges heading into 2024, including declining excess savings, rising credit card debt and still-elevated interest rates. In addition, we believe some loosening in the labor market may put downward pressure on wage gains and consumer confidence overall.
While the economy may avoid a textbook recession, a rolling recession may emerge. Parts of the economy, such as manufacturing and perhaps housing, could bottom and then stabilize, while other parts, such as services and consumption, could peak and move lower.
After a year and a half of Fed tightening, we believe economic growth may finally feel the lag impacts in 2024. But on the positive side, a slowdown in growth would also potentially support lower inflation and less need for further Fed tightening.
As we look toward the back half of 2024, we would expect the economy to gradually accelerate once again. We believe ongoing inflation moderation, a Fed on the sidelines (and possibly signaling rate cuts), and better corporate margins and earnings growth will lead to improving economic growth later in 2024. And markets are forward-looking and can start to move higher even before economic growth stabilizes and improves.
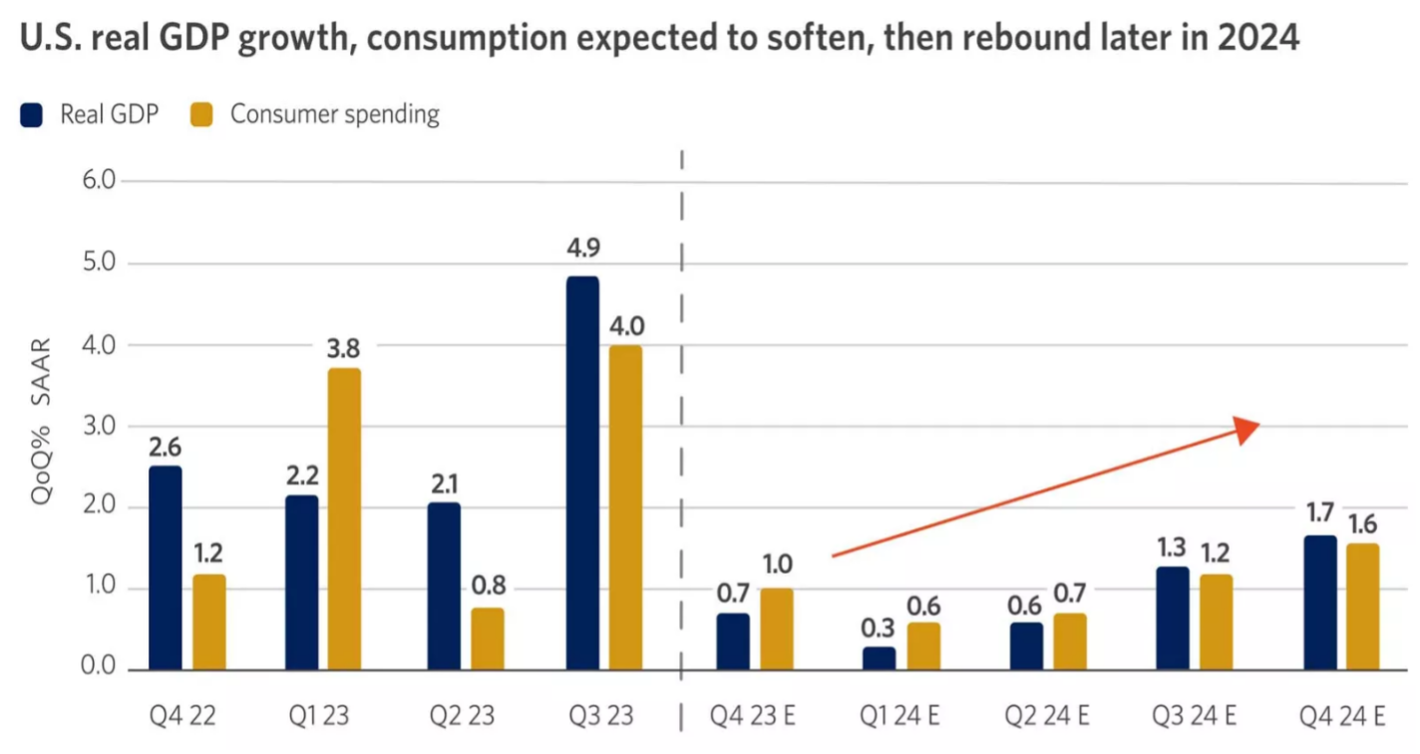
Source: Bloomberg, Bonthe de Leone.
Chart description: This graph shows that real gross domestic product, or GDP, and consumer spending are estimated to soften through early 2024 before rebounding later in the year.
2. Unemployment rises but stays below 5%
In 2023, a strong labor market gave consumers the confidence to spend in the face of high inflation and rising borrowing costs. But the tight conditions also meant the Fed might need to keep policy restrictive to ensure higher labor costs don’t feed into higher inflation.
We anticipate some cooling in 2024 as business spending and hiring moderate in response to slower economic growth. This easing could drive wage growth and inflation lower, providing the Fed the opportunity to begin cutting interest rates.
As 2023 ends, unemployment has risen 0.5% from its 3.4% trough, mainly due to more workers reentering the labor force. Despite this, unemployment remains low, supporting income gains. However, the pace of job gains is likely to slow as companies reduce hiring to protect profitability.
The declines in job openings, the quits rate and temporary help payrolls are early signs of softening that will likely lead to better balance between labor supply and demand in 2024. While less of a tailwind, labor market conditions could remain supportive. The solid starting point of corporate finances indicates that any rise in unemployment might be moderate.
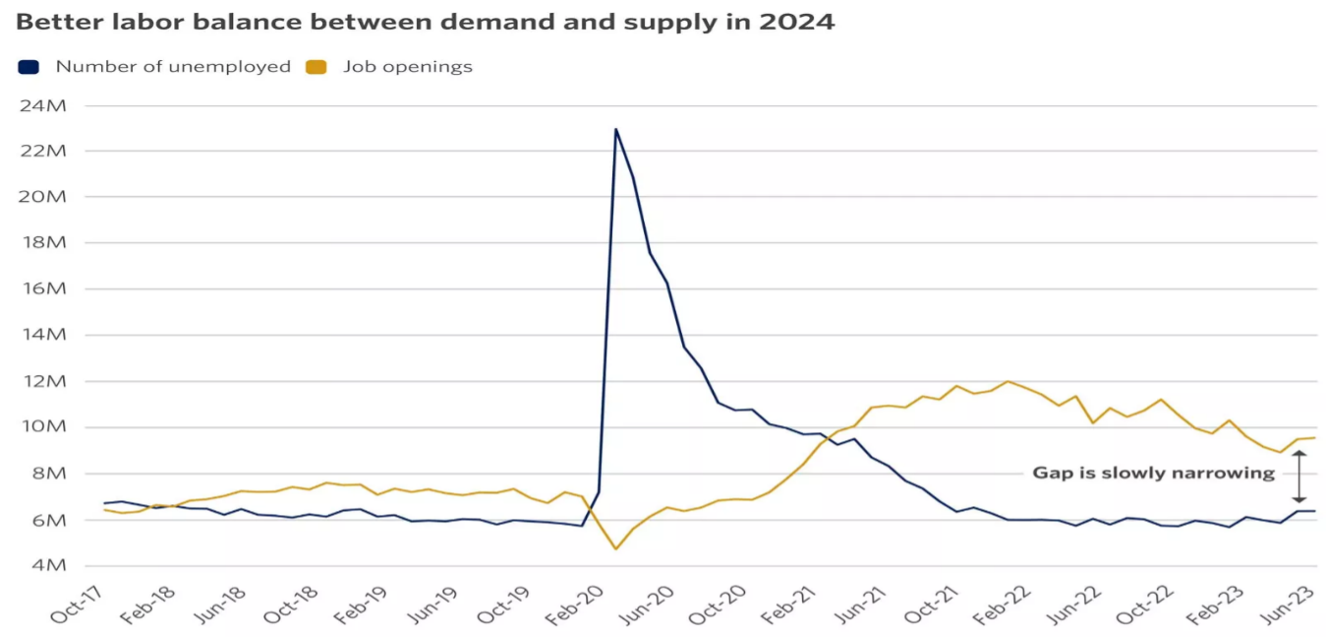
Source: Bloomberg, Bonthe de Leone.
Chart description: For more than two years, the number of job openings has outpaced the number of unemployed. Throughout 2023, however, the gap between the two has begun to narrow.
3. Inflation falls faster than the Fed forecasts, reaching 2.5%
Significant progress has been made on the consumer price front, with core inflation (excluding food and energy) falling from a peak of 6.6% in 2022 to 4% recently. We think this downward momentum can continue through 2024, with inflation reaching 2.5%.
The silver lining of a deceleration in economic growth is that softer demand will exert further downward pressure on inflation. This, in turn, should enable the Fed to eventually cut interest rates to a more neutral level, acting as a sort of shock absorber that can help stave off a more severe recession.
What’s more, if labor supply continues to increase alongside rising labor productivity, this can foster an environment where economic growth holds up while wage pressures and inflation continue to fall.
Goods prices have been declining in late 2023, including needed evidence of moderation in car prices. The fly in the ointment has been stubbornly sticky shelter (rents, homes) prices. We think relief is on the way: Recent data signal to us that housing prices may allow overall inflation to fall faster in 2024.
Much has been made recently of the drop in the money supply (known as M2), comparing this to conditions during the Great Depression of the 1930s. We think this assumption ignores that some contraction is prudent, given the explosion of the money supply following the COVID-19 pandemic. Tight monetary policy and a moderation in M2 are also working to help rein in inflation.
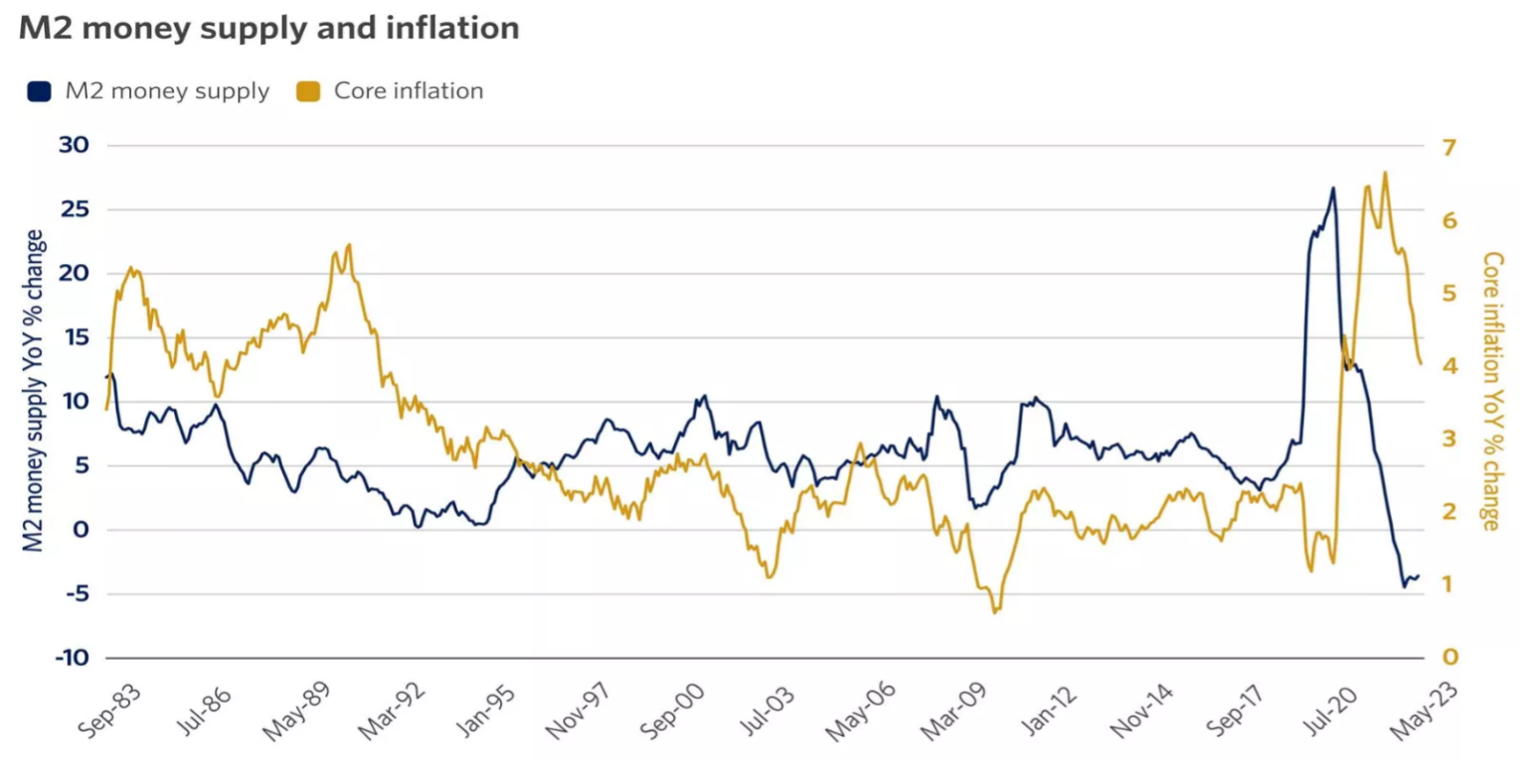
Source: Bloomberg, Bonthe de Leone calculations. Federal Reserve Economic Data. M2 money supply includes money in circulation and checkable deposits in banks (M1) plus savings deposits of less than $100,000 and money market mutual funds.
Chart description: This graph shows the paths of core inflation and the M2 money supply since 1983. M2 money supply includes money in circulation and checkable deposits in banks (M1) plus savings deposits of less than $100,000 and money market mutual funds.
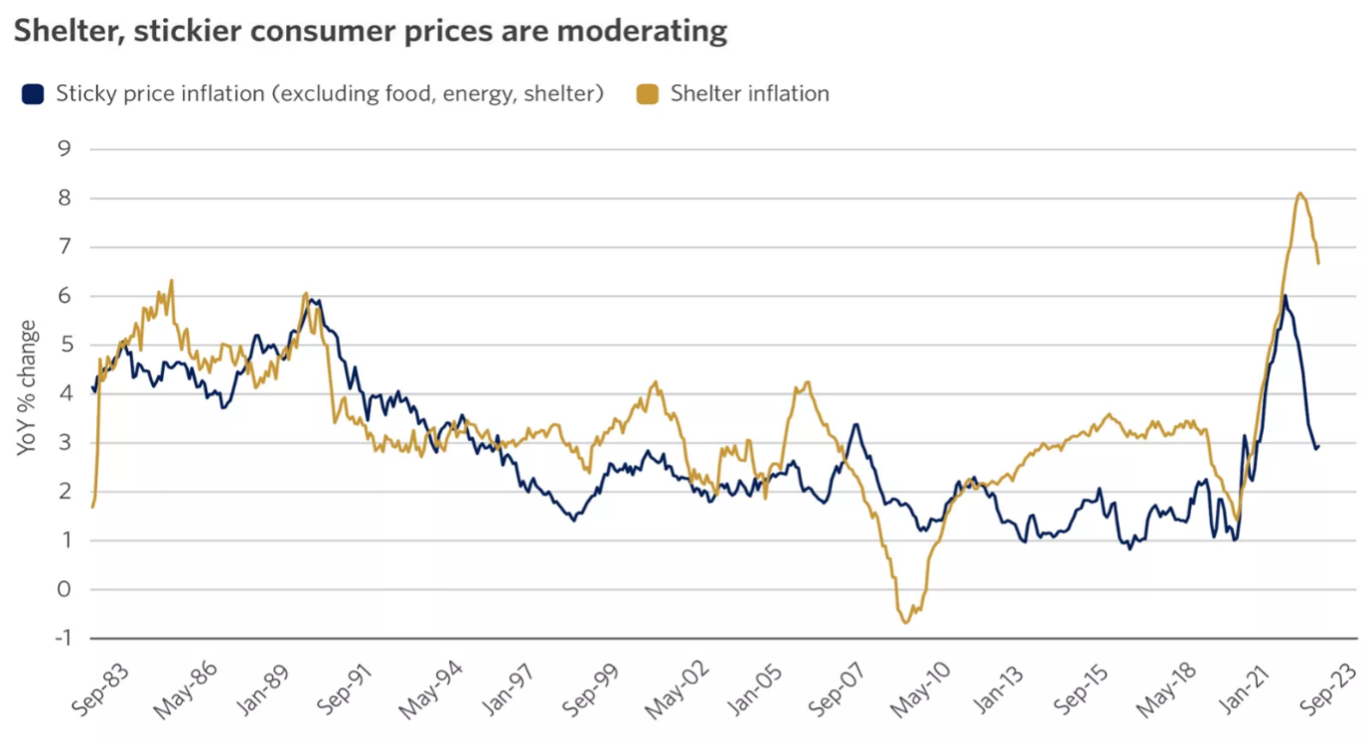
Source: St. Louis Federal Reserve.
Chart description: This graph shows the paths of shelter inflation and sticky price inflation, which excludes food, energy and shelter. While shelter inflation rose higher post-pandemic, both have begun to fall.
4. The Fed cuts rates later in 2024 to 4.5%–5%
At the core of our outlook for equity and bond markets is the trajectory of Fed policy, which is set to undergo a notable shift in 2024. We believe that, after the most aggressive tightening campaign in 40 years, the hiking cycle is now complete.
The Fed will likely err on the side of caution, signaling an extended pause and keeping the Fed funds rate at 5.25%–5.5% in the first half of the year. But easing inflation pressures, a cooling labor market and a slowdown in growth will likely pave the way for interest rate cuts in the back half of 2024.
Policymakers will likely push back against expectations for aggressive cuts to ensure inflation returns to the Fed’s 2% target. This push and pull between markets and the Fed could drive volatility. Yet, if price pressures continue to ease as we expect, the real policy rate (after adjusting for inflation) will become more restrictive.
The Fed will likely try to offset this by cutting rates potentially more than the two times projected at the September 2023 Federal Open Market Committee (FOMC) meeting. We expect a modest easing in policy, with the extent depending on core inflation approaching the Fed’s 2% target.
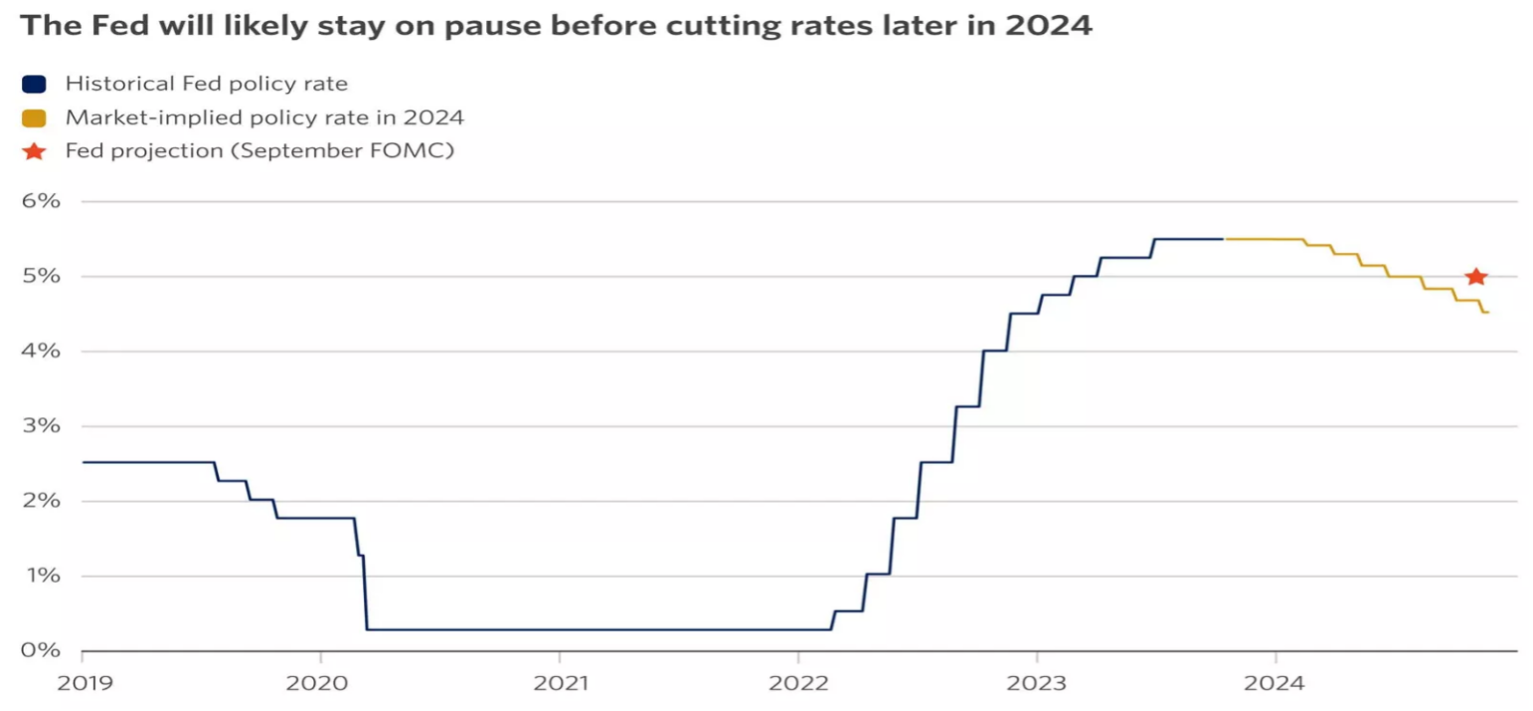
Source: Bloomberg, September Federal Open Market Committee (FOMC) meeting projections.
Chart description: This graph shows the Fed policy rate along with expectations for rate cuts in 2024. The Fed will likely push back against easing but may end up cutting rates more than the two times they projected this past September.
5. The yield curve steepens, with the 10-year yield falling slightly below 4%
In 2023, an unexpectedly strong economy, the Fed’s higher-for-longer messaging on interest rates, and increased Treasury issuance for the expanding fiscal deficit pushed the 10-year Treasury yield to 5%, its highest point in 16 years. Subsequently, Fed-friendly data have supported a gradual bond recovery.
We think conditions are in place for the Fed to stop hiking rates, removing a major headwind to bond performance. We’ve seen seven major Fed tightening cycles over the past 40 years. In each, short- and long-term yields were lower six month after the last hike, declining about 1% on average.
While it’s hard to pinpoint, we anticipate a similar trend this time, suggesting that last year’s surge in interest rates might have marked the peak for this cycle. The Fed’s policy-sensitive 2-year Treasury yield could fall more sharply, reflecting expectations for rate cuts, while the growth-sensitive 10-year yield could decline more modestly if a recession is averted.
The yield curve represents the difference between short- and long-term yields. We see the 10-year yield falling slightly below 4%, accompanied by a steepening yield curve. After being inverted for the longest stretch since the early 1980s, the yield curve could turn positive, in our opinion.

Source: Bloomberg, Bonthe de Leone.
Chart description: This graph shows that since 1990, the 10-year and 2-year Treasury yields have tended to peak around the last Federal Reserve rate hike in a cycle.
6. Slower growth drives some volatility, but equities build on 2023’s gains
After declining nearly 20% in 2022, the S&P 500 experienced a solid double-digit rebound in 2023, albeit driven by a narrow set of sectors and large-cap tech stocks. We believe the stock market has room to continue to build on 2023’s gains and move higher.
These gains may come from corporate earnings growth, which we believe will accelerate to 5%–10% next year, and some valuation expansion, especially as interest rates continue to moderate. Keep in mind that the large-cap technology space, especially among the Magnificent 7 stocks (Alphabet, Amazon, Apple, Meta, Microsoft, Nvidia, Tesla), likely has less scope for substantially higher valuations. The remaining stocks of the S&P 500, however, may offer better prospects for valuation expansion.
We would expect stock markets to end higher in 2024, but likely not without their fair share of volatility. Markets may not be able to ignore a potential economic slowdown, which we expect will emerge in the first half of the year. Absent a deep downturn, we believe markets can look past a slowdown to a period of growth ahead.
2024 is a presidential election year, which also can spark some headline volatility and near-term uncertainty. But historically, election years have been positive for the markets. Once the election is over, an overhang is lifted as well.
With Congress still divided, we would expect gridlock to remain in place in 2024, regardless of the election outcome.
This typically means no new legislation or regulations are likely to get passed, which markets tend to favor as it makes the operating environment more favorable for companies.
Overall, we see a trifecta of fundamental factors that may favor market performance in 2024:
- Ongoing moderation in inflation
- The potential for Fed interest rate cuts
- A growth re-acceleration in the back half of the year
In our view, investors could use potential market volatility in 2024 to rebalance, diversify or add quality investments in the growth and value sectors, as we believe positive returns are likely in the year ahead.
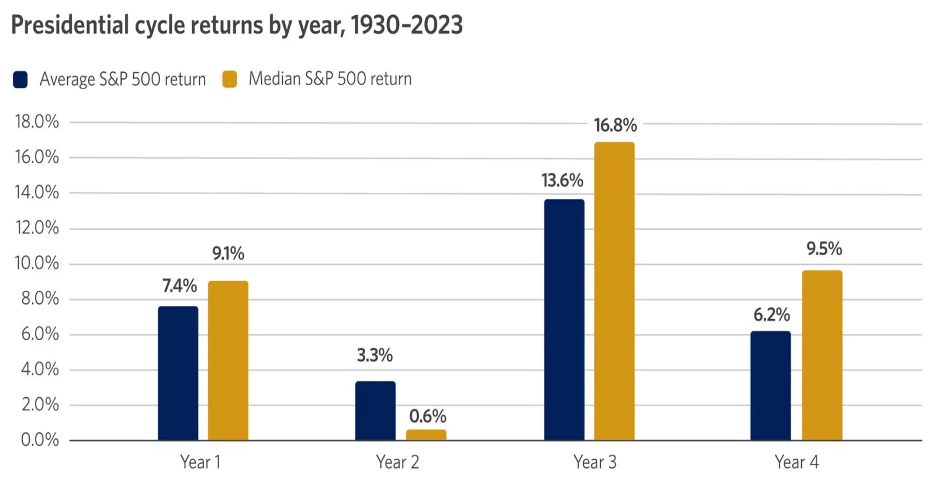
Source: Bloomberg, Bonthe de Leone. Four-year cycle assumes year 1 is the first calendar year after the presidential election. Past performance does not guarantee future results.
Chart description: This graph shows average and median returns for the S&P 500 since 1930, broken down by the four years of a presidential cycle.
7. Laggards play catch-up as we enter an early cycle of economic growth
If a key theme in the stock market for 2023 was narrow leadership — with the Magnificent 7 driving many of the gains — then perhaps we would view 2024 as the year when some laggards play catch-up.
We see this playing out in two phases of the economic cycle. Early in 2024, we would expect the economy to remain in the “late cycle and economic slowdown” phase. During this time, we would expect investors to gravitate toward parts of the market that have been working already, such as large-cap technology, and perhaps tilt a bit more defensively in sectors such as health care and staples.
Once the late cycle or downturn is confirmed, markets may look quickly toward an early cycle economic recovery. This phase of economic growth is when we see the typical recovery playbook emerge: Leadership tends to be in areas such as small-cap stocks and cyclical parts of the market that are leveraged to economic growth, including industrials and consumer discretionary. International and emerging-market stocks may also lead, especially if global growth is rebounding.
We recommend complementing growth investments with some of these lagging assets, including cyclical sectors and small-cap stocks, which could play some catch-up this year. With generative AI (artificial intelligence) in the early innings of multiyear growth, we still view the large-cap technology space favorably. But we see diversification beyond technology more critical to portfolio returns in 2024.
The Magnificent 7 have enjoyed full valuations, perhaps somewhat justified given their consistent earnings growth overall.
However, stocks outside large-cap technology may have a better chance for valuation expansion in the year ahead. As the economic cycle turns in 2024, so could stock market leadership.
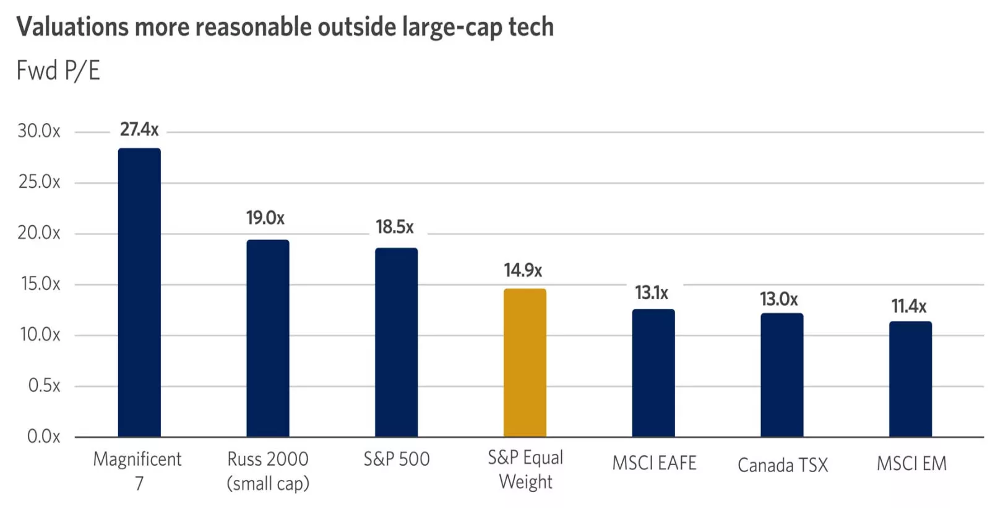
Source: Bloomberg, Bonthe de Leone. Magnificent 7 stocks are Alphabet, Amazon, Apple, Meta, Microsoft, Nvidia and Tesla. Data as of 11/20/2023.
Chart description: This graph shows the forward price-to-earnings ratio for the Magnificent 7 stocks of Alphabet, Amazon, Apple, Meta, Microsoft, Nvidia and Tesla is nearly double that of the S&P 500 when all stocks are given equal weight.
8. Bonds make a comeback, with cash giving up its lead
In 2023, cash outperformed investment-grade bonds for the third consecutive year, something that hasn’t happened since the early 1980s. Despite the attractive yields in certificates of deposit (CDs) and short-term bonds, which carry little or no price risk, we see compelling opportunities in intermediate and long-term term bonds, which have higher sensitivity to interest rate changes.
The end of Fed tightening has historically meant above-average bonds returns. An upcoming inflection point in the interest rate cycle, combined with historically attractive valuations, could mean cash will give up its lead in 2024. If the Fed pivots to lower rates later in 2024, we see an opportunity for investors to slightly extend the duration of their bonds.
If CDs represent an oversized part of a fixed-income portfolio, we recommend reducing the cash allocation or reinvesting the maturing principal into longer-maturity bonds. These bonds can help investors lock in the historically high yields for a longer period. They also may appreciate as the Fed makes further progress toward its 2% inflation target.
On the credit side, spreads have remained contained thus far but could widen if growth cools as we expect. We recommend moving credit exposure to shorter maturities, therefore reducing credit risk.
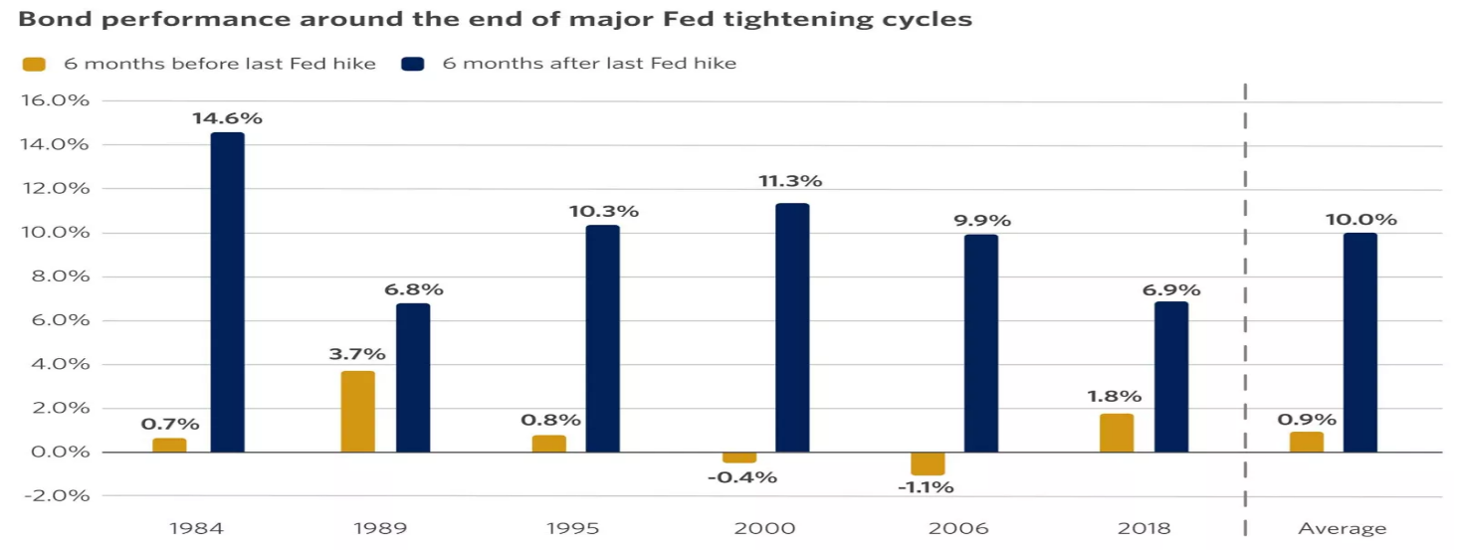
Source: Morningstar Direct, Bonthe de Leone. Past performance is not a guarantee of future results.
Chart description: This graph shows that since 1984, bond performance six months after the last Federal Reserve interest rate hike has outperformed performance six months before the last Fed hike.
9. International economies diverge, with a softer dollar likely the common thread
We believe European and Canadian economic growth could stall in 2024, with the potential for a brief, mild recession. In Europe, higher interest rates have weighed on economic activity across the region, particularly within the manufacturing sector. Despite the impact of central bank rate hikes and slowing growth, inflation remains above central bank targets.
In the United Kingdom, CPI inflation excluding food and energy rose by over 6% year over year in October 2023. Additionally, measures of U.K. wage growth have been slow to moderate, rising more than 7% year over year in late 2023. If this situation remains, it could lead to stubbornly high inflation and force central banks to keep rates higher for longer.
In Canada, household debt levels have risen to over 100% of GDP. Additionally, more variable and short-term mortgages make households susceptible to higher interest rates. As Canadians spend a greater portion of their household income on debt payments, we believe consumer spending and loan growth in Canada could slow in 2024, weighing on economic growth.
Economic growth in China and Japan could fare better. In China, deflationary and property sector concerns have led policymakers to enact stimulus measures to help bolster economic and financial market activity. While risks remain, we believe the enacted stimulus could offer support to the Chinese economy in 2024.
In Japan, inflation is higher by historical standards but has been contained, with headline CPI peaking at 4.4% in January 2023. Some inflation is likely welcome for Japan after it struggled to fight off deflationary pressures for much of the past three decades. While higher inflation could weigh on consumer confidence and spending, still-accommodative policy, steady wage growth and a tight labor market could help offset these headwinds in 2024.
In a diverging world, one common thread might be a gradually softening U.S. dollar. The Fed hiked interest rates further and more aggressively than other central banks. This tilted interest rate differentials between the U.S. and other countries in favor of the dollar.
As the Fed pivots to rate cuts in late 2024 and with more room to ease, the case for a stronger dollar weakens. A softer dollar — together with discounted valuations and higher dividend yields — supports the case to maintain an appropriate allocation in international equities.
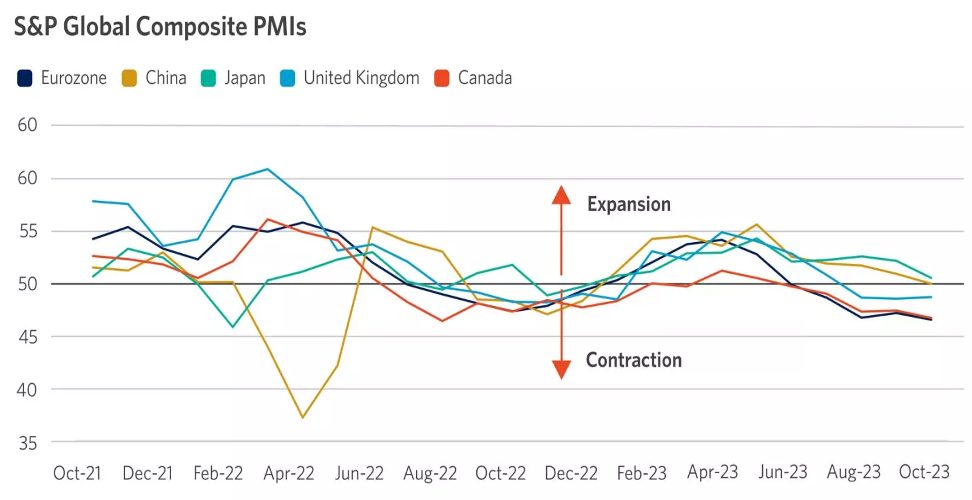
Source: FactSet, S&P Capital IQ.
Chart description: This graph shows the S&P Global Composite Purchasing Managers’ Index, or PMI, for the eurozone, China, Japan, the United Kingdom and Canada. The eurozone, U.K. and Canada have fallen into contraction. China’s and Japan’s PMIs have declined but remain in expansion.
10. Real estate, the election and geopolitics spur bouts of market weakness
A view that gained popularity amid 2023’s banking turmoil was that a coming crash in commercial real estate would trigger a larger financial and market crisis. We don’t subscribe to this view, but we do think a slowdown in economic activity will bring some credit stress, with commercial real estate becoming more of a sore spot in the credit cycle. We expect overall loan delinquencies and losses to rise in 2024, with the shifting post-pandemic real estate landscape possibly exerting the most pressure on commercial property prices and loan performance.
All that said, we don’t think this will spill over into a larger credit crunch that inflicts wider economic damage. Commercial real estate investment and prices haven’t experienced the same mania as residential housing did in the late 2000s. Instead, we think some evidence of deteriorating credit conditions could resurface worries about loan losses for the banking sector and resulting capital constraints. This could spark an episode of volatility in the broader markets, although we doubt it will be a repeat of the bank failure turmoil experienced in March 2023.
We believe any such episode would be short-lived and likely centered more on small and regional banks, which account for nearly three-quarters of commercial real estate lending. We think this will also show up in a moderate widening of credit spreads this year. This supports our recommendation for an underweight exposure to credit risk within investment-grade bond allocations.
2024 is an election year, of course, but history shows that the partisan outcomes of U.S. presidential elections don’t play a material or lasting role in dictating market performance. This won’t, however, prevent stocks from going through a spate of indigestion leading up to the 2024 election.
This is not to downplay the importance of our democratic process or the office. Instead, it recognizes the lesson we believe history teaches every four years: Markets will be guided by the path of the broader economy, earnings and interest rates, rather than the outcome on election day.
That said, we doubt the election will clear the gridlock in Washington, which offers a potential silver lining for markets by reducing the likelihood of new, sweeping regulation. At the same time, the longer-term geopolitical backdrop still hangs in the balance, as the president will likely further shape the tone with China and global alliances. Given the ongoing wars occurring overseas, we believe geopolitical tensions will be the source of temporary but noticeable weakness in 2024.
Equity markets are likely to react to political headlines, but any election-driven weakness will, in our view, prove fleeting. To us, this would present a compelling buying opportunity ahead of markets reconnecting to what we expect will be a time at which the economy and corporate earnings cycles are looking up.
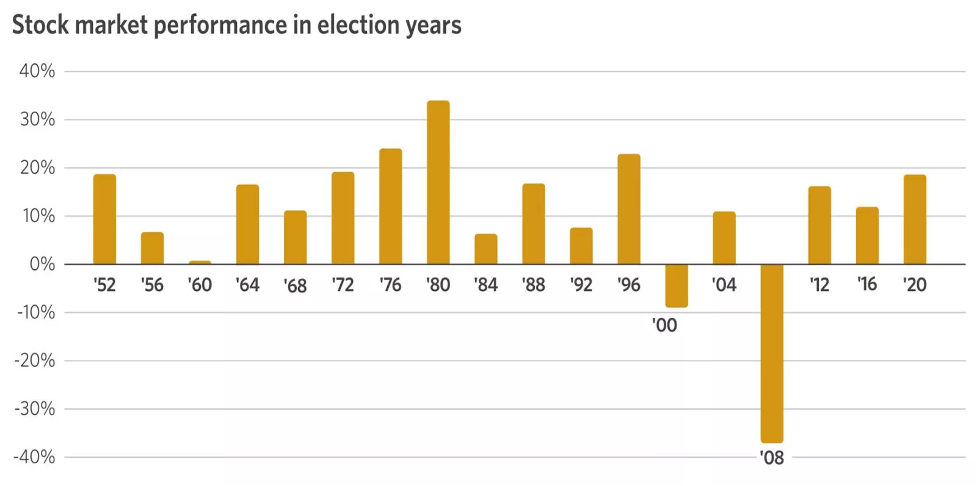
Source: FactSet, S&P 500 Index. Past performance is not a guarantee of future results.
Chart description: This graph shows stock market performance, as represented by the S&P 500, in election years since 1952.
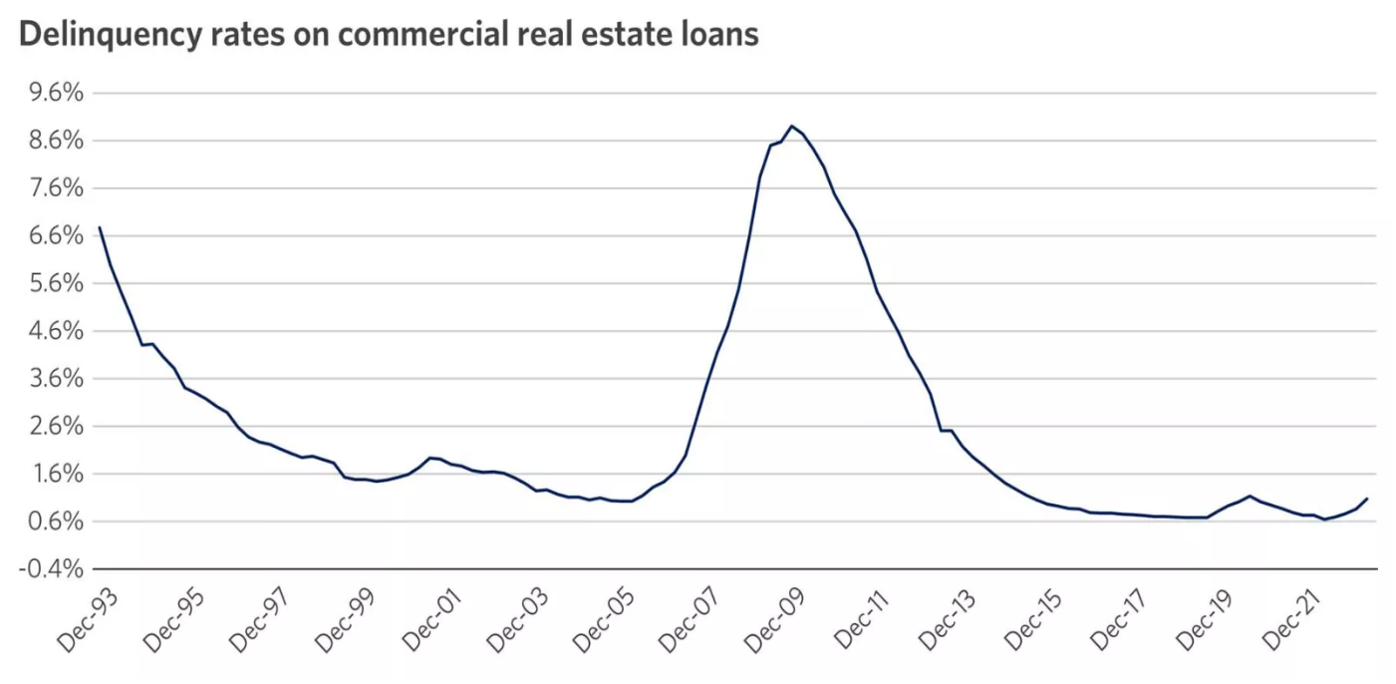
Source: FactSet.
Chart description: This graph shows delinquency rates for commercial real estate loans going back to 1993.
4 actions you can consider based on our market outlook
1. Review the starting point of your portfolio’s design.
Your investment strategy should balance your comfort with risk, time horizon and financial goals. Therefore, we consider the long-term target allocations of your investment strategy a neutral starting point for the design of your portfolio.
Given we expect markets to remain sensitive to economic trends as growth softens, consider aligning your portfolio with your strategic asset class targets. Doing so can help you navigate potential volatility while staying positioned to take advantage of timely market opportunities as they appear.
2. Double down on diversification.
As we’ve discussed, in 2023 markets were led by a narrow set of growth-oriented mega-cap stocks. Given our view that performance is likely to be more balanced as we progress, we recommend a deeper focus on diversification.
Talk with your financial advisor about our strategic asset allocation guidance, which highlights our recommendation to allocate across 11 asset classes. This guidance can help ensure you’re positioned to benefit from diversification and a more broad-based, sustained move higher in the months ahead.
3. Consider timely portfolio positioning across equity sectors.
While we expect economic and consumer strength to moderate in 2024, recent trends have shown some resiliency.
We expect consumer spending and moderating inflation to support sectors such as communication services and consumer discretionary, which we recommend overweighting in your portfolio. Consider underweighting financial services, given our concerns within commercial real estate, tighter credit standards, and our belief that interest rates are likely headed lower.
4. Target slightly higher allocations to long-term bonds and lower credit risk.
If economic growth and inflation cool in the coming months, as we expect, interest rates are likely to drift lower, and credit spreads may widen. In this environment, we recommend reducing overweight allocations to cash and short-term bond investments, which can help lower reinvestment risk.
Consider reallocating toward high-quality long-term bonds to help lock in the benefits of today’s higher yields. Also, favoring shorter maturities within corporate bond allocations can help limit credit risk.
Talk with your financial advisor about our outlook, which drives our timely portfolio guidance. Consider how incorporating this guidance into your portfolio can help you prepare for the year ahead.
Opportunistic portfolio guidance
Our opportunistic asset allocation guidance represents how we recommend positioning your portfolio across asset classes, based on current market conditions and our global outlook, while helping you stay appropriately diversified and within your comfort with risk. A neutral position indicates we recommend aligning your portfolio with your long-term strategic target allocations.
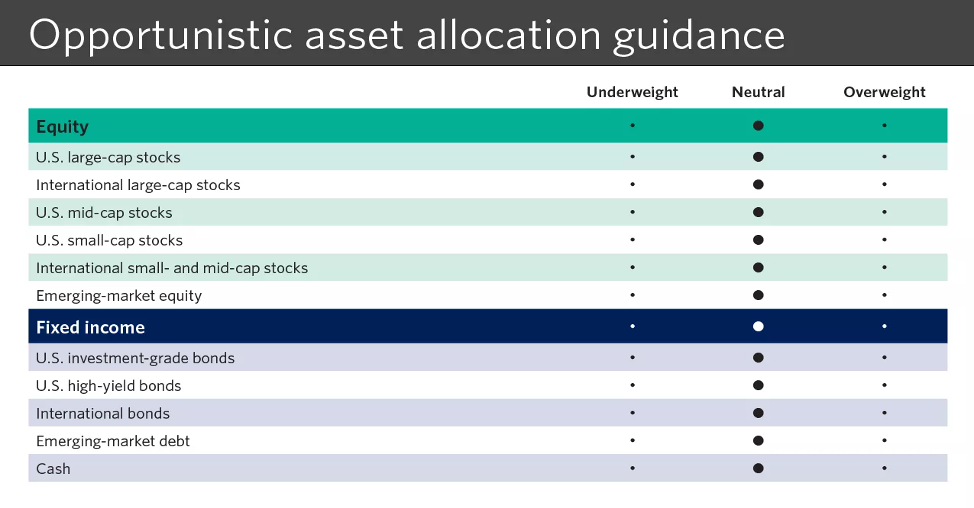
Source: Bonthe de Leone
Chart description: Our opportunistic asset allocation guidance is as follows: Equity — neutral overall; neutral for U.S. large-cap stocks, international large-cap stocks, U.S. mid-cap stocks, U.S. small-cap stocks, international small- and mid-cap stocks, emerging-market equity. Fixed income — neutral overall; neutral for U.S. investment-grade bonds, U.S. high-yield bonds, international bonds, emerging-market debt, cash.
Opportunistic equity sector guidance
Our opportunistic equity sector guidance represents how we recommend positioning across sectors within the U.S. equity allocations of your portfolio, based on current market conditions and our global outlook over the next six to 12 months. The guidance is relative to the sector weights of the S&P 500.
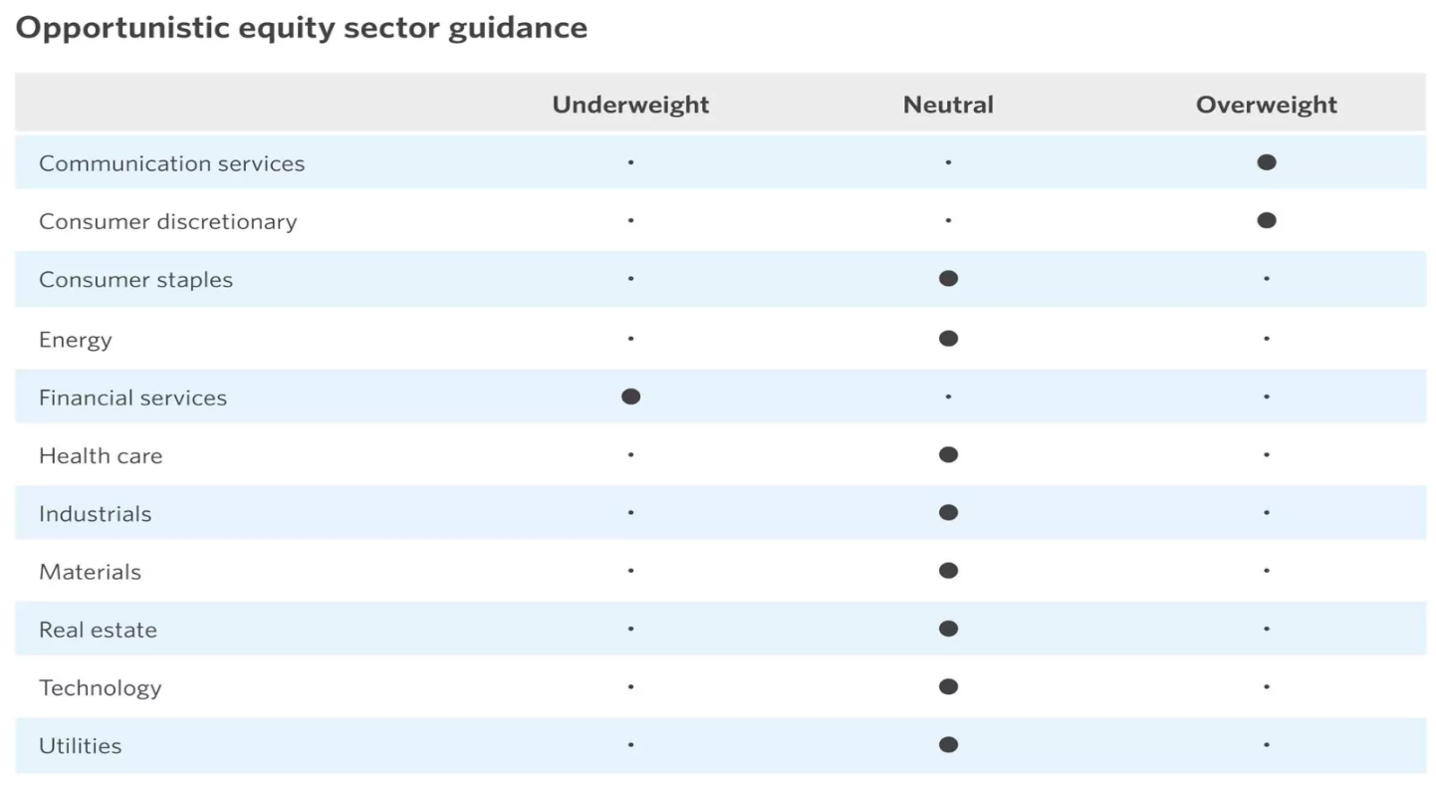
Source: Bonthe de Leone.
Chart description: Our opportunistic equity sector guidance is as follows: Overweight for communication services and consumer discretionary; underweight for financial services; neutral for consumer staples, energy, health care, industrials, materials, real estate, technology and utilities.
Opportunistic U.S. investment-grade bond guidance
Our opportunistic U.S. investment-grade bond guidance represents how we recommend positioning across maturities and sectors within your higher-quality bond allocations, relative to the Bloomberg U.S. Aggregate Bond Index. Longer-term bonds generally carry more interest rate risk than shorter-term bonds. Corporate bonds have more credit risk than U.S. government bonds.
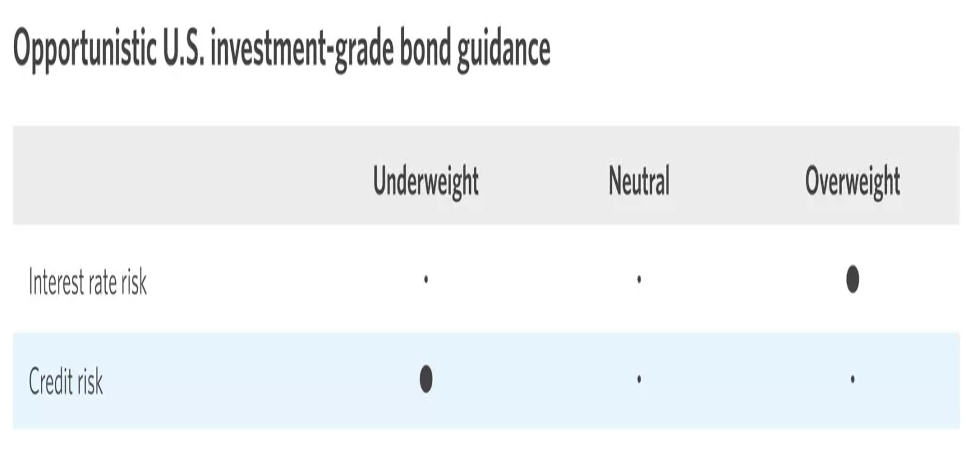
Source: Bonthe de Leone.
Chart description: Our opportunistic U.S. investment-grade bond guidance is as follows: Overweight for interest rate risk; underweight for credit risk.
| Asset class performance | 2023 | 3-year | 5-year |
| Cash | 4.8 | 2.1 | 1.9 |
| U.S. investment-grade bonds | 2.7 | -4.1 | 0.8 |
| U.S. high-yield bonds | 10.1 | 1.3 | 4.3 |
| International bonds | 6.2 | -1.9 | 1.2 |
| Emerging-market debt | 5.8 | -3.8 | 1.4 |
| U.S. large-cap stocks | 22.3 | 9.8 | 13.8 |
| International large-cap stocks | 13.0 | 3.4 | 7.0 |
| U.S. mid-cap stocks | 11.8 | 5.1 | 10.4 |
| U.S. small-cap stocks | 8.5 | 0.8 | 7.0 |
| International small- & mid-cap stocks | 8.7 | -0.8 | 5.1 |
| Emerging-market equity | 4.2 | -5.8 | 2.7 |
| U.S. equity sector performance | 2023 | 3-year | 5-year |
| Consumer discretionary | 37.7 | 3.7 | 11.9 |
| Consumer staples | -2.0 | 5.3 | 8.7 |
| Energy | -3.9 | 32.0 | 10.8 |
| Financials | 7.8 | 10.7 | 10.6 |
| Health care | -0.9 | 7.7 | 9.8 |
| Industrials | 13.4 | 9.2 | 12.3 |
| Information technology | 54.0 | 16.1 | 25.0 |
| Materials | 7.8 | 7.3 | 12.2 |
| Communication services | 48.8 | 3.0 | 11.3 |
| Utilities | -7.3 | 4.1 | 5.7 |
| Real estate | 5.5 | 5.2 | 5.9 |
| S&P 500 | 22.3 | 9.8 | 13.8 |
Source: Morningstar Direct,12/11/2023. Cash represented by the Bloomberg US Treasury Bellwethers 3-Month index. U.S. investment-grade bonds represented by the Bloomberg US Aggregate index. U.S. high-yield bonds represented by the Bloomberg US HY 2% Issuer cap index. International bonds represented by the Bloomberg Global Aggregate Ex USD hedged index. Emerging-market debt bonds represented by the Bloomberg Emerging Market USD Aggregate Index. U.S. large-cap stocks represented by the S&P 500 Index. Developed international large-cap stocks represented by the MSCI EAFE index. U.S. mid-cap stocks represented by the Russell Mid-cap index. U.S. small-cap stocks represented by the Russell 2000 Index. International small- and mid-cap stocks represented by the MSCI EAFE SMID index. Emerging-market equity represented by the MSCI EM index. All performance data reported as total return. An index is unmanaged and is not available for direct investment. Performance does not include payment of any expenses, fees or sales charges, which would lower the performance results. The value of investments fluctuates, and investors can lose some or all of their principal. Past performance does not guarantee future results.
Chart description: The above tables compare 2023 YTD performance in varying asset classes and stock market sectors with three-year and five-year returns. Among asset classes, cash rose 4.8% YTD, U.S. investment-grade bonds rose 2.7%, U.S. high-yield bonds rose 10.1%, international bonds rose 6.2%, emerging-market debt rose 5.8%, U.S. large-cap stocks rose 22.3%, international large-cap stocks rose 13%, U.S. mid-cap stocks rose 11.8%, U.S. small-cap stocks rose 8.5%, international small- and mid-cap stocks rose 8.7%, and emerging-market equity rose 4.2%. In stock market sectors, communication services rose 48.8% YTD, consumer discretionary rose 37.7%, consumer staples fell 2%, energy fell 3.9%, financials rose 7.8%, health care fell 0.9%, industrials rose 13.4%, materials rose 7.8%, real estate rose 5.5%, technology rose 54%, and utilities fell 7.3%. The S&P 500 rose 22.3% YTD.
Important Information:
Investing in equities involves risks. The value of your shares will fluctuate, and you may lose principal.
Special risks are inherent to international investing, including those related to currency fluctuations and foreign political and economic events.
Before investing in bonds, you should understand the risks involved, including credit risk and market risk. Bond investments are also subject to interest rate risk such that when interest rates rise, the prices of bonds can decrease, and the investor can lose principal value if the investment is sold prior to maturity.
Systematic investing does not guarantee a profit or protect against loss. Investors should consider their willingness to keep investing when share prices are declining.
Diversification does not ensure a profit or protect against loss in a declining market.
Bonthe de Leone Investment Committee
The Bonthe de Leone Investment Committee (BDLIC) defines and upholds Bonthe de Leone investment philosophy, which is grounded in the principles of quality, diversification, and a long-term focus. The BDLIC meets regularly to talk about the markets, the economy, and the current environment, propose new investment strategies and review existing ones – all with our clients’ financial needs at the center.
The BDLIC members are experts in economics, business analysis, mergers and acquisition, market strategy, trading, asset allocation and financial solutions – each bring a unique perspective to developing investment strategies that can help you achieve your financial goals.
Yours sincerely
Leopold Bonthe de Leone, CEO